기술자료 IDEA StatiCa Deep beams – Strut and tie VS Non linear models
페이지 정보

본문
Deep beams – Strut and tie VS Non linear models (prontubeam.com)
As it is well known, the deep beam stress distribution does not follow the classical beam plane stress state. The smaller the ratio span/height is the more different is the stress distribution compared with a beam. For this reason, it is always suggested to study the deep beams using a strut and tie model. The aim of this article is to compare the hand-made proposed strut and tie model for a deep beam against a full non-linear calculation. In particular, it will be focussed on the main lower tie.
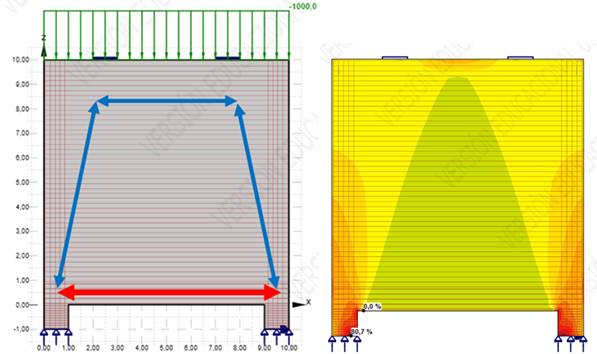
Figure 1. Deep beam stress distribution (right) and proposed strut and tie model (left)
Geometry and reinforcement
For this article it is used a deep beam of 10m length, 10m height (H>L), 0.5m width supported on both sides by 1mx1mx0.5m supports, leaving a free span of 8m between support inner faces. The deep beam will be reinforced in the lower main tie with 5C20 (15.7cm2) placed in the lower 1.35m (recommended in 0.15*L as presented below, with L equal to the distance between support axis, in our case 9m, therefore 0.15*9=1.35m).
Calculations
Two calculations will be performed:
· Strut and tie hand-made calculation – This will be based on the model proposed in the book “Dimensionnement des constructions selon l’Eurocode 2 à l’aide des modèles bielles et tirants” of Jean-Louis BOSC.
· Non-linear calculation – A full non-linear for the concrete (C40, fcd=fck=40MPa considered for simplicity) and steel (fyd=fyk=500MPa) materials, with yielding cracking and crushing properties. This will be performed with the software IDEA StatiCa Detail. The following figure presents the material laws, for further details refer to IDEA StatiCa material definition.
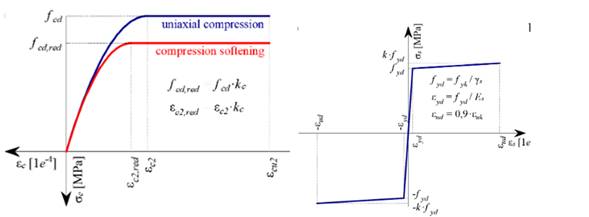
Figure 2. Deep beam non-linear material laws
Hand-made calculation
This calculation is based on the following schema, extracted from “Dimensionnement des constructions selon l’Eurocode 2 à l’aide des modèles bielles et tirants” of Jean-Louis BOSC, where the lower tie is considered full yielded:
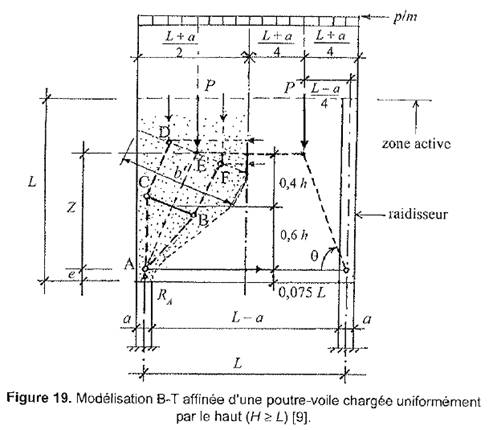
Figure 3. Strut and tie model from “Dimensionnement des constructions selon l’eurocode 2 à l’aide des modèles beilles et tirants”, a book of Jean-Louis BOSC
Following the methodology proposed in the mentioned book, the main tie is calculated as follows:
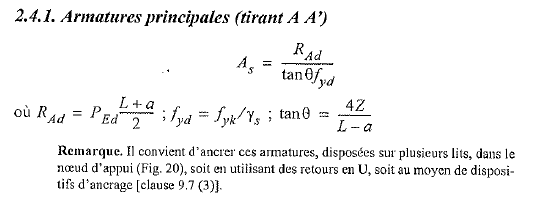
Figure 4. Strut and tie model - Lower main tie calculation
Therefore, considering that the main tie is composed of 5C20 (15.7cm2) and that no safety factor is applied for the materials (for simplicity fyd=fyk) the maximum applicable load on the top of the beam would be:

Therefore, 4239kN can be uniformly applied on the top of the deep beam before its collapse following the hand-made strut and tie model.
Non-linear calculation
The same geometry of the deep beam as for the strut and tie calculation will be used, modelled with IDEA StatiCa software. This means that the main tie is modelled in the lower part, with a total area of 1570cm2 (5 layers of C20 are modelled) fully anchored. No other reinforcement will be modelled. The hand-made calculated load of 4239kN will be applied and analysed the results. It has been checked with Construsoft that IDEA StatiCa software, for stability purposes, uses a 0.3MPa for the concrete tensioned areas with an admissible plastic strain of 7%. Otherwise, the model could not converge on the top side where there is no reinforcement (only low main tie reinforcement is modelled). Therefore, this is similar to provide a secondary reinforcement of 3cm2/m to resist this tension load proposed by the software (0.3MPa x 1m x 0.5m / 500MPa = 300mm2/m = 3cm2/m (less than the minimum reinforcement)).
Two load configurations will be applied. One, considering the load uniformly applied on the top of the beam and, another one, considering that the load is already concentrated in two points, as considered by the strut and tie hand-made calculation.
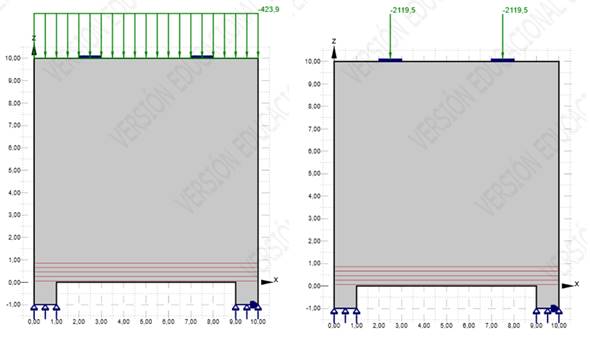
Figure 5. Deep beam model loading using IDEA StatiCa
In this article we are mainly interested in the lower tie reinforcement. As it can be seen in the following pictures, for both cases, the main tie is working between 250MPa (left case) and 296MPa (right case). Both of them are quite far from the 500MPa considered in the strut and tie model.
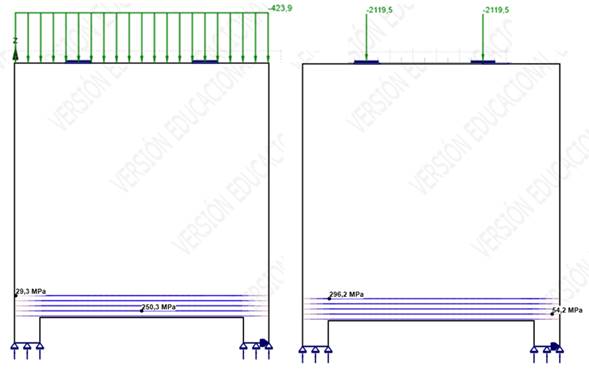
Figure 6. IDEA StatiCa deep beam model results – Stress in the lower main tie
As already mentioned, it has been checked with Construsoft that IDEA StatiCa software, for stability purposes, uses a 0.3MPa for the concrete tensioned areas with an admissible plastic deformation of 7%. Otherwise, the model could not converge on the top side without reinforcement. Therefore, a secondary reinforcement of 3cm2/m should be provided to resist this tension load proposed by the software (0.3MPa x 1m x 0.5m / 500MPa = 300mm2/m = 3cm2/m (less than the minimum reinforcement).
The principal stress directions is as follows:
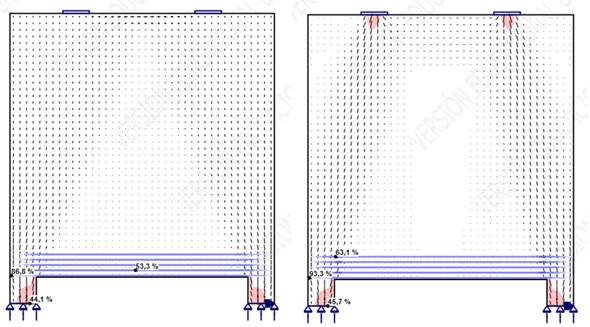
Figure 7. IDEA StatiCa deep beam model results – Main stress directions
The following figures presents the stress distribution on the concrete for both cases:
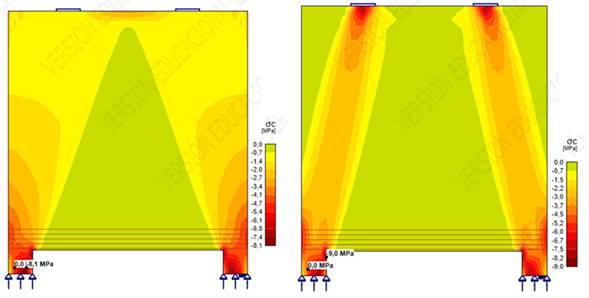
Figure 8. IDEA StatiCa deep beam model results – Stress distribution
As presented above, it is noted that there is a difference between the hand made results and the model ones. In particular, it is noted that there is a difference in the stress distribution in the model and in the hypothesis for the hand-made strut and tie calculations. The distance between the top compresion strut and the main lower tie is notably smaller in the hand made calculation than in the software one.
We are going to perform one last calculation, where the load are placed exactly where the strut and tie model:
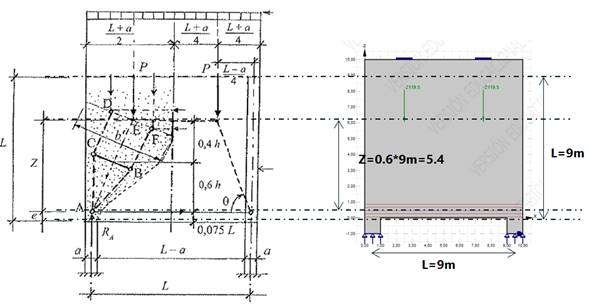
Figure 9. Strut and tie model presented in IDEA StatiCa software
In this case, the following results are obtained:
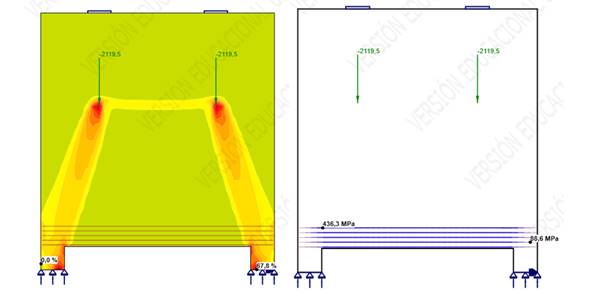
Figure 10. Results of the strut and tie model presented in IDEA StatiCa software
As it can be seen, in this case the main lower tie is working at 436MPa, which is much closer to the theorical hand-made calculation (strut and tie model).
As a final test, it is calculated the value of the load that would produce the failure in the non-linear IDEA StatiCa model. The load is increased as to get the maximum admissible load. The following values are found:
· For the case with the load uniformly distributed: the maximum load is 8490kN, producing the rupture of the lower main tie.
· For the case with the load concentrated on the top, in two points, the maximum load is 7950kN, producing also the failure of the lower main tie.
It is reminded that the hand-made calculation resulted in 4239kN. Thefore, it seems that the hand-made calculation provides safety factors of 2 compared to the non-linear model.
Conclusions
The following conclusions are extracted from this article:
· The hand-made calculation, using the strut and tie model, gives lower resisted loads than the non-linear model. The strut and tie models can be considered as the lower bound.
· Factors of 1.5 to 2 (depending on the case) are obtained when comparing the strut and tie model and the non-linear one. However, in the non linear calculation, as only the lower main tie is modelled, to converge, it is needed to assume that a tensile stress in the concrete is produced and resisted. The IDEA StatiCa assumes 0.3MPa with a plastic limit strain of 7%. This might be similar to reinforcing with 3cm2/m in the whole heigth of the deep beam
· It is noted that the level arm (Z) considered in the strut and tie model (5.4m) is smaller that the one on the non linear calculation (approximately 8m-8.5m). When the non-linear calculation is adapted to match the strut and tie level arm, the results converge quite well (436MPa in the non-linear calculation againts the 500MPa of the hand-made strut and tie one)
· It is confirmed that the uniform load is less limitant than the two ponctual equivalent loads. The difference for the studied case is 250Mpa against 296MPa
It is noted that only one type of beam has been tested and that all the information here presented is to be considered for information only. It is the engineer in charge of the calculation who needs to verify the calculation and ensure that is complient with the project standards.
첨부파일
-
Deep-beams-Strut-and-tie-VS-Non-linear.pdf (1.1M)
1회 다운로드 | DATE : 2024-01-15 12:11:59
- 이전글The Seri Wawasan Bridge in Putrajaya, Malaysia | RWIND 2 Model 24.01.15
- 다음글Flexible Photovoltaic Mount | Structural Analysis Model for RFEM 6 24.01.15
댓글목록
등록된 댓글이 없습니다.